Shailesh Codes
Low risk, high reward — an intro to site reliability engineering

I had the opportunity recently to work with a senior engineer on a reliability related app. Maybe not the most exciting piece of news, but site reliability is a topic that is deceptively engaging.
For the unfamiliar, it's an often overlooked but very important aspect of creating and deploying apps. It deals with getting your app online, and making sure it stays online. After all, what good is a website when it's down half the time? Rhetorical question, but definitely not much.
A risky business
A large part of working with site reliability is assessing and mitigating risks. Risks can vary — things like a Kubernetes pod going down, or a bad configuration being pushed through the CI/CD pipeline — and each risk affects possible downtime in different ways. To try and standardize all of this uncertainty, site reliability engineers (SREs) use some key metrics.
Uptime
The first (and arguably most important) metric is uptime. This metric actually comes in two flavors — downtime (minutes per year), and availability (%). The former represents how many minutes a service is down in a 365 day period, and the latter represents what percentage of the past year a service has been up. They're linked by a pretty simple equation:
Hey, it looks like you're on a slightly narrower screen. The code blocks below might not look too good, but the rest of the article should be fine. You can hop on a wider screen if you want to follow along. I'm not going anywhere (promise).
      downtime = (1 - availability) * 365.25 * 1440;
      availability = 1 - (downtime / (365.25 * 1440));
Those formulas should make sense easily — there are on average 365.25 days in a year, and each day has 1440 minutes. As an aside: the number of minutes associated with availability is also known as the error budget — for example, 99.999% availability has an error budget of just over 5 minutes.
Generally, you'll see some common values for availability labeled as "x nines". This is a shorthand way of saying extremely high values like 99% (two nines), 99.9% (three nines), 99.99% (four nines), and so on. These numbers might come in the same ballpark as terms like SLA, SLO, and SLI. We won't go into those in this post, but I strongly recommend this article from Google Cloud on what each of those terms mean. If you've read that and are interested in reading further, this book by Alex Hidalgo is also a good read.
Risks
Risks have their own metrics too. There are four standard ways a risk can affect uptime: ETTD, ETTR, % impact, and ETTF. I know three of those look the exact same, but bear with me.
ETTD stands for Estimated Time to Detection. In short, it counts how many minutes it takes before an outage is detected by the appropriate team of engineers. Different risks have different ETTD values, but they're generally in the same ballpark. If, for example, a Kubernetes pod goes down, then an engineer would be notified fairly quickly. If the whole logging system goes down (including your paging system), it might take a longer time.
ETTR is the Estimated Time to Resolution. This is where things can start to vary somewhat. Issues like a dead container can be resolved in a handful of minutes by starting a new one. More complex issues like broken third-party integrations might take longer to troubleshoot and resolve.
These first two issues can often be difficult to address and optimize, just by their nature. ETTD values are generally low, and ETTR values depend heavily on the expertise of the specific engineer called to resolve the issue.
The next two are multipliers, and optimizing them can result in significantly better uptime. % impact refers to what percentage of the user base is impacted by the downtime. This varies extremely widely based on the risk. A dead Kubernetes pod might affect 5% of traffic, but a breaking change in a third-party API could affect 100%.
Finally, ETTF, or Estimated Time to Failure, stands for the time in between this risk appearing in your service. A risk could appear every few months, every few hours, or every few years — it can vary significantly.
Given these four metrics, we can calculate two very important values. First, the number of incidents per year:
incidents = 365.25 / ETTF;
It says it all on the label. The number of incidents per year directly correlates to how frequently the risk appears.
The next computed value is slightly more intensive. Known as bad minutes per year, it's calculated via the following formula:
badmins = (ETTD + ETTR) * impact * incidents;
It makes sense when you look at it. Each incident takes so many minutes to detect, and another handful to resolve. Add those together, and multiply it by the percent of traffic it impacts. Finally, multiply it by the number of times it's expected to happen each year. The end result is an objective way to calculate the impact of individual risks.
Risk factors — a spanner in the works
While the system above is already plenty complicated, the real world is so complex that we often need another layer of complication before we get accurate results. There are some factors that apply to every risk equally, but are not a risk in themselves.
For example, there's a possibility that engineers are not near their phones, which might add an extra 10 or so minutes to the ETTD of every single risk. Maybe the codebase has a lot of technical debt, so the ETTR increases by 30 minutes every outage. Whatever the case, we assign these risk factors delta values (delta ETTD, delta ETTR, delta % impact, delta ETTF) to determine how much they affect the corresponding values for every risk.
These risk factors are varied and, as mentioned above, add an entirely new layer of risk management and assessment. We'll have a look at how they can affect uptime and availability a little later.
Tolerance
For now, I hope that the relationship between uptime and risks becomes a bit more obvious as you scan the metrics. If availability is determined by how many minutes a service is down, and each risk has the potential to take a service down for so many minutes each year, it should be clear that the goal is to keep the sum total of risks below that desired availability threshold.
In an ideal world, we would find a way to mitigate every risk and have 100% availability with 0 downtime, ever. But that's not reality. Something always has to give. The key is to pick and choose which risks are acceptable, and which need to be mitigated or optimized.
Suppose your app is deployed on a Kubernetes cluster, and has three key risks: a pod goes down, a bad config gets deployed, and a third party API gets changed. You're aiming for four nines, and so have about an hour of downtime per year.
Using some back of the napkin calculations, you figure that the pod going down scenario has about 45 bad minutes per year. The next risk — bad config — has about 30 bad minutes per year. The last has about 5 bad minutes per year.
Clearly, you can't tolerate the first two risks together. You can tolerate either of the first two and the third party API risk, but no more than that. So, as an SRE, you work hard on reducing bad config deployments, ensuring that you'll be able to hit four nines with the remaining risks.
Striking out
Another layer of nuance: generally, you don't want any one risk to represent too large a portion of the whole. This helps ensure that there isn't one factor that is causing your app to fail time and time again. In the previous example, we might say that we don't want any risk to represent more than 50% of the total budget.
That means we can't tolerate the risk associated with Kubernetes pods, since that represents 75% of the total budget. Instead of mitigating bad config deployments, your focus should be on reducing the pod risk. As an added bonus, you'll have a lot more room in your budget, since you know all the remaining risks still fall below your limit.
What was that about an app?
As you might be able to see, while each individual concept is relatively simple, there are lots of layers and moving parts when it comes to site reliability. Not just risks, but risk factors, and then availability and downtime and individual thresholds — there's a lot to keep track of.
There aren't a lot of tools to help SREs figure out which risks to tolerate and which ones to mitigate. It often takes a lot of guesswork and quick and dirty calculations to arrive at a final result. More precise methods like spreadsheets can often be confusing, which is counterproductive — the process needs to be quick and easy, not slow and complex.
To tackle this issue, I worked with a senior SRE to develop a free and open source app called get-risky. It's a simple service — just a handful of endpoints on a Go backend with a static frontend — but it could help save many SREs a LOT of time.
The best part is that it looks good — the exact opposite of many enterprise tools. We care very much about how the app looks and feels, because SREs don't need to be slowed down by clunky interfaces and unintuitive controls.
We only have two views currently. The first allows the user to edit the services, since some engineers might use more than one service. You can see what that looks like below:
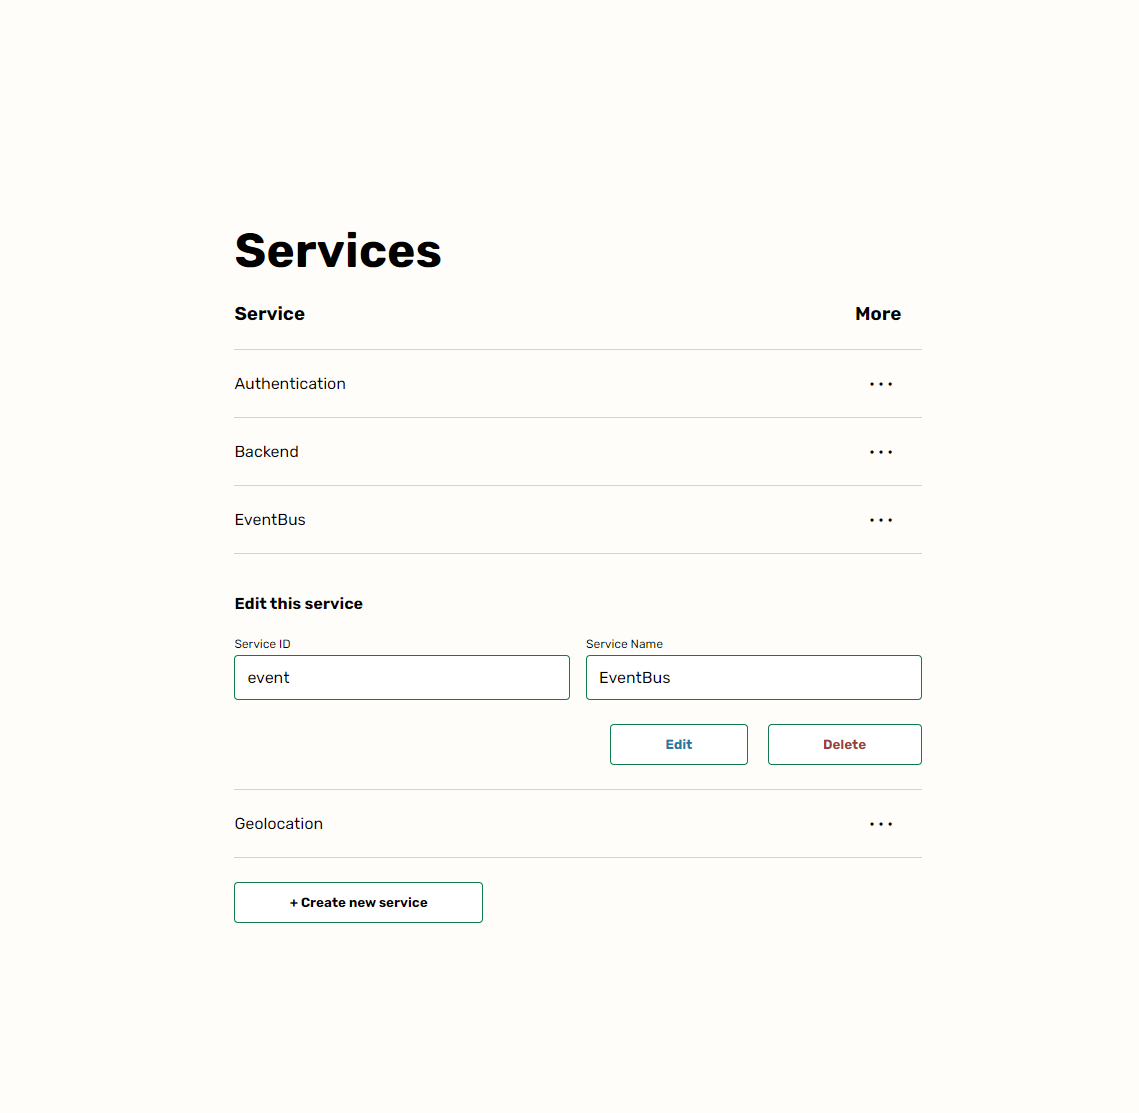
The More button allows the user to edit or delete a service. Simple CRUD. The second view is the real crux of the app, and allows the user to figure out which risks are tolerable and which aren't. It also allows the user to edit risk factors from the same page. You can check it out via this link.
It might be a lot to take in, but it's easy to see that there are really only two inputs: availability, and individual threshold. It's possible to customize the risks by clicking on the ‘More' dropdown, and there are options to 'accept' the risk and see how that affects the remaining risks.
All the important information is right at the top too — error budget, the number of bad minutes accepted, how many minutes are remaining, and what the threshold is for an individual risk. There are lots of small bits and pieces, but you'll have to discover those yourself by using the app!
Hopefully, the information is there when it's needed, but recedes into the background when it's not. Our hope is that while it might not revolutionize the field of site reliability, it'll help make it a bit more mainstream, a bit more user-friendly, and a bit more accessible.
If you're interested in this vision, we're always looking for contributors, and we're more than happy to welcome first-time coders as well. If you're not sure where to start or how you can help, feel free to drop me a line: [email protected].
At the end of the day, we're all about helping each other and the community get better. We can do that by managing one risk at a time.


Comments